
An interactive graph showing DNA nanotube insertion in a POPC membrane using WebGL and UnityMol CG based on a model from @maingivishal. Try the web-based UnityMol app.
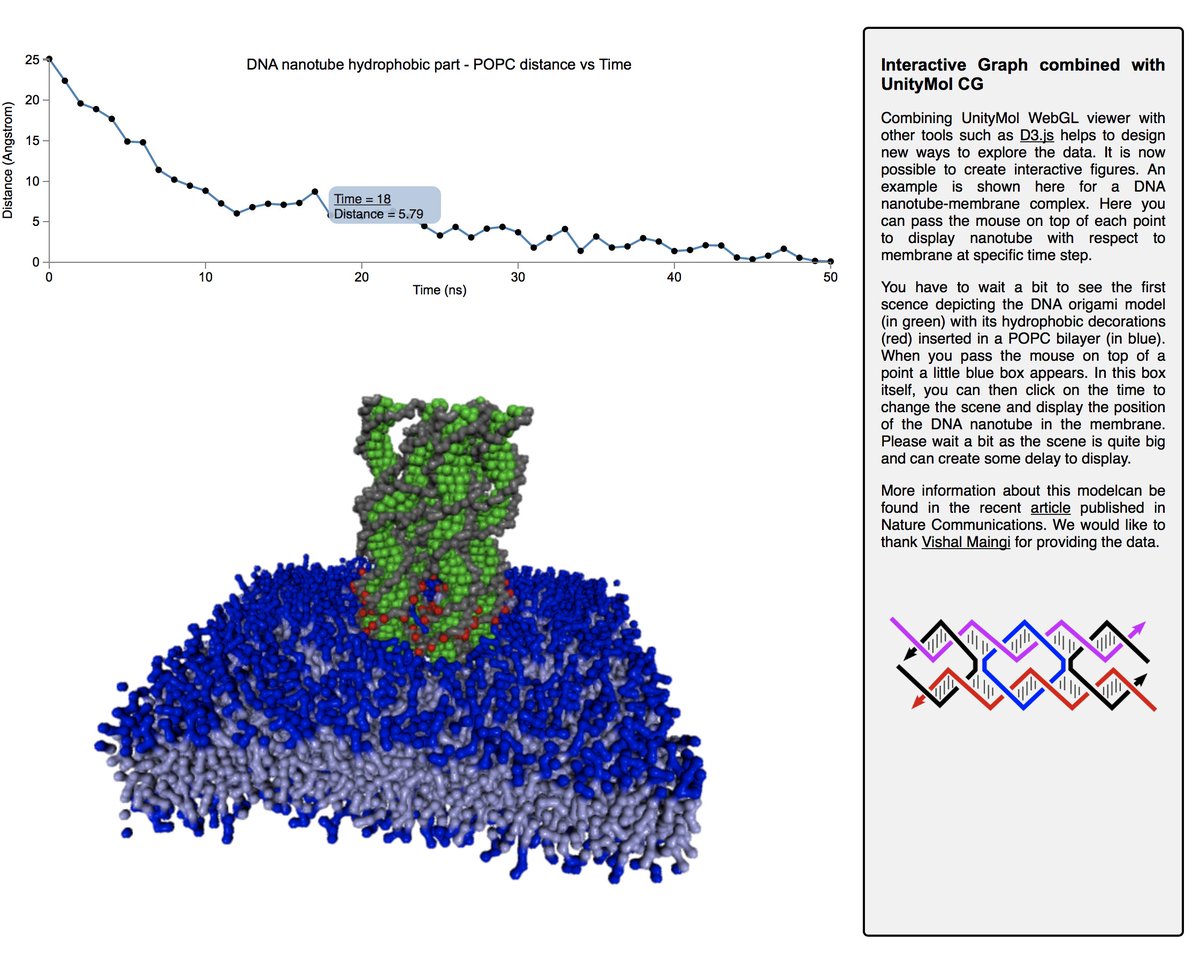
Combining UnityMol WebGL viewer with other tools such as D3.js helps to design new ways to explore the data. It is now possible to create interactive figures. An example is shown here for a DNA nanotube-membrane complex.
(This was originally posted on Twitter/X)